
Executive summary
This report analyzes online student readiness across 131,418 browser and device scans collected between October 2017 and April 2026.. It reports only signals measured directly at the device: operating-system and browser currency, connection speed and latency, plugin presence, and protocol versions. It deliberately sets aside composite readiness scores and pass rates, which are computed against thresholds each institution configures for itself and therefore measure institutional standards rather than the device landscape (see Methodology).
Read on the raw signals, the nine years tell two stories at once. Infrastructure modernized dramatically: median download speed rose roughly fourfold (37 to 146 Mbps), upload roughly fivefold (6 to 32 Mbps), latency nearly halved (151 to 81 ms), Flash and other legacy plugins disappeared, and TLS 1.3 went from essentially absent to near-universal. But device and software currency did not improve. The share of students arriving with an outdated browser held between roughly one in three and one in two across the entire period, and outdated operating systems followed the same stubborn pattern. The net result: roughly six in ten students still arrive with at least one fixable readiness issue, a rate that has held for nine years. The pipe got faster; the endpoints did not get more current.
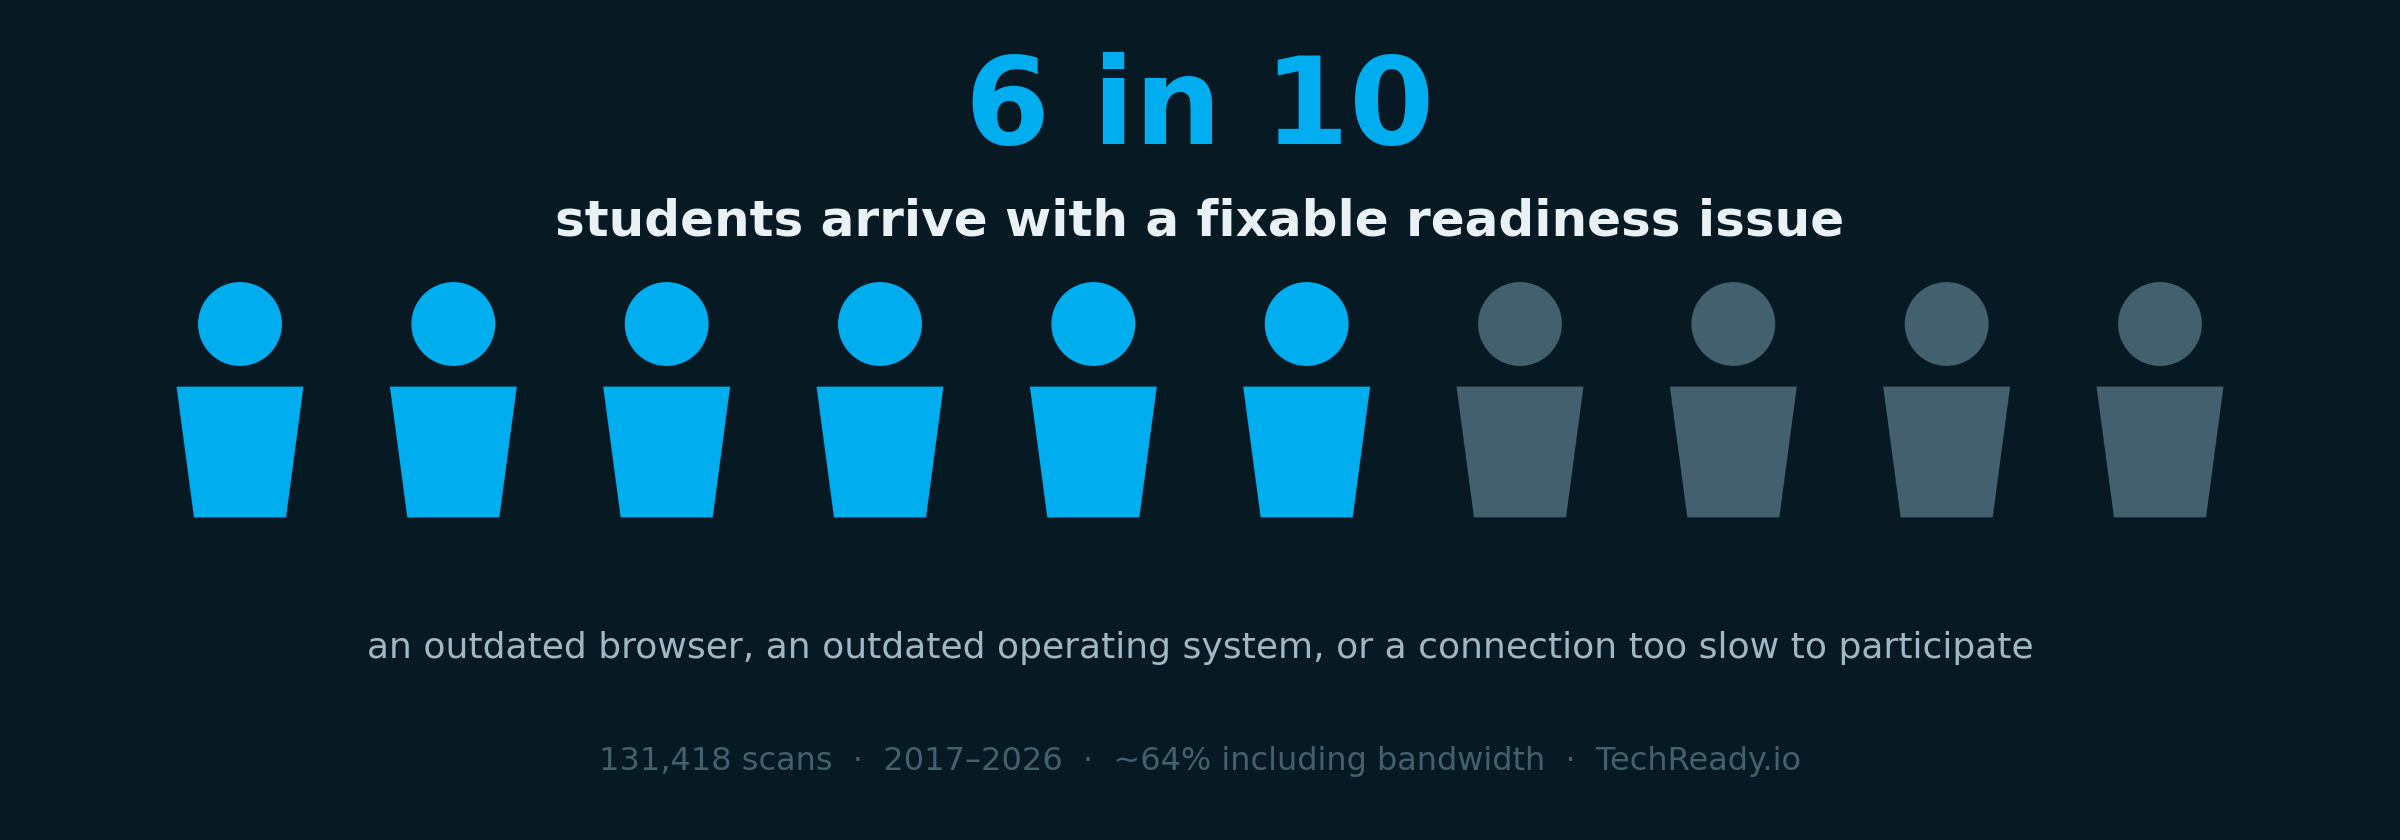
That gap is the finding. It is also why this report focuses on the directly-measured signals rather than composite readiness scores. Any composite blends many tests against thresholds each institution sets for its own context, which makes it useful locally but subjective, and hard to compare across schools or across nine years. The device-level trends are not.
Methodology: what we measure, and what we set aside
Each record is one scan event, a student running the readiness check in their browser. Each scan captures device and connection facts directly: operating system and version, browser and version, download and upload speed, latency, plugin presence, and TLS version. These are objective measurements. No institution can re-weight them.
We set aside composite readiness scores and pass rates in this report. Those figures depend on thresholds and test weightings that each institution sets for its own context, and reasonably so: what counts as ready for one program may differ for another. That makes the composite a useful local tool but a subjective one. It is not directly comparable across institutions, and because those settings evolve, not directly comparable across years either. To keep this a like-for-like view over nine years, we report only the signals measured directly at the device, which mean the same thing in 2017 as they do in 2026. Year-level rollups use each scan’s timestamp; 2017 and 2026 are partial years.
The nine-year arc
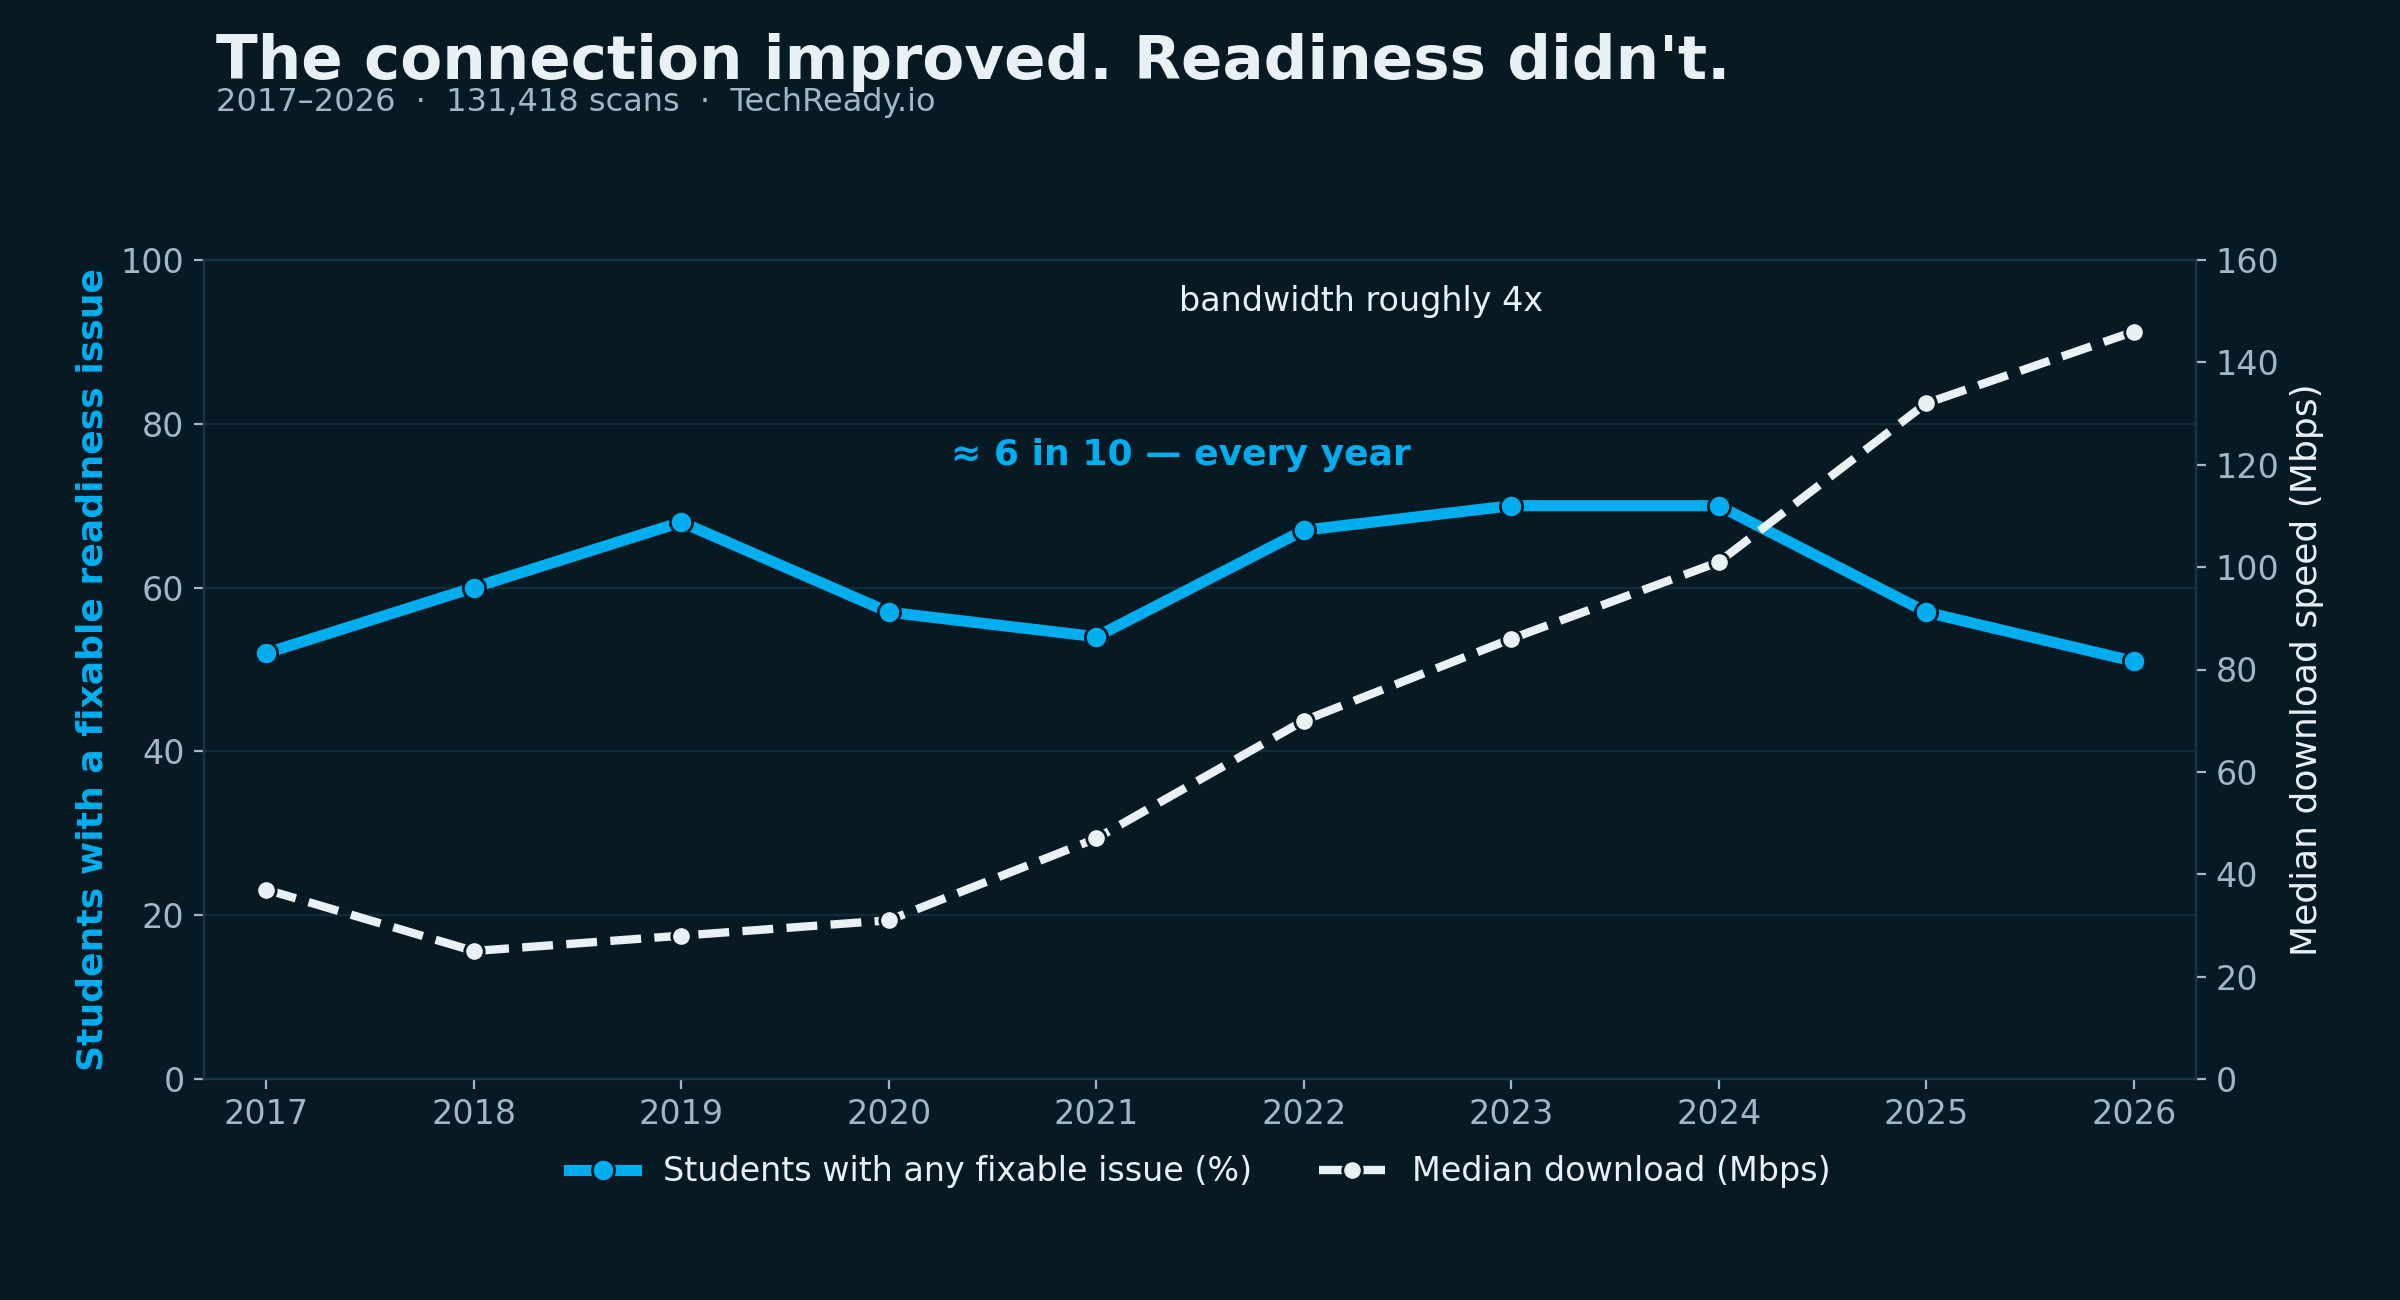
The clearest way to see both stories is side by side: the connection metric climbs steadily, while browser and OS currency, and the combined “any issue” rate, do not.
What the raw data actually shows
- The connection modernized; the device did not. Every connectivity signal improved on a clear curve: download roughly 4x, upload roughly 5x, latency nearly halved, TLS 1.3 near-universal. Browser and OS currency show no such trend. Outdated browsers ranged from 34% to 48% year to year with no downward slope, ending in 2026 (34%) essentially where they began in 2017. The combined result is the six-in-ten figure: across the full period, roughly 60% of scans (about 64% with bandwidth) show at least one fixable issue, and that rate has not fallen. Infrastructure is solving itself; endpoint readiness is not.
- Legacy technology was retired by external deadlines, not by students upgrading. Flash fell from 46% of devices (2017) to effectively zero by 2022, the year Adobe formally blocked it. Internet Explorer and Windows 7 (end-of-life January 2020) followed the same pattern: they disappeared because their makers ended them, and where they lingered they were the hardest tail to reach. The readiness problems that resolve on their own are the ones with a vendor deadline behind them; the rest persist.
- Mobile-carrier students are a structural gap, in device terms. Students whose sessions originate on a mobile-carrier network arrive with materially worse conditions across every objective measure, not a composite score:
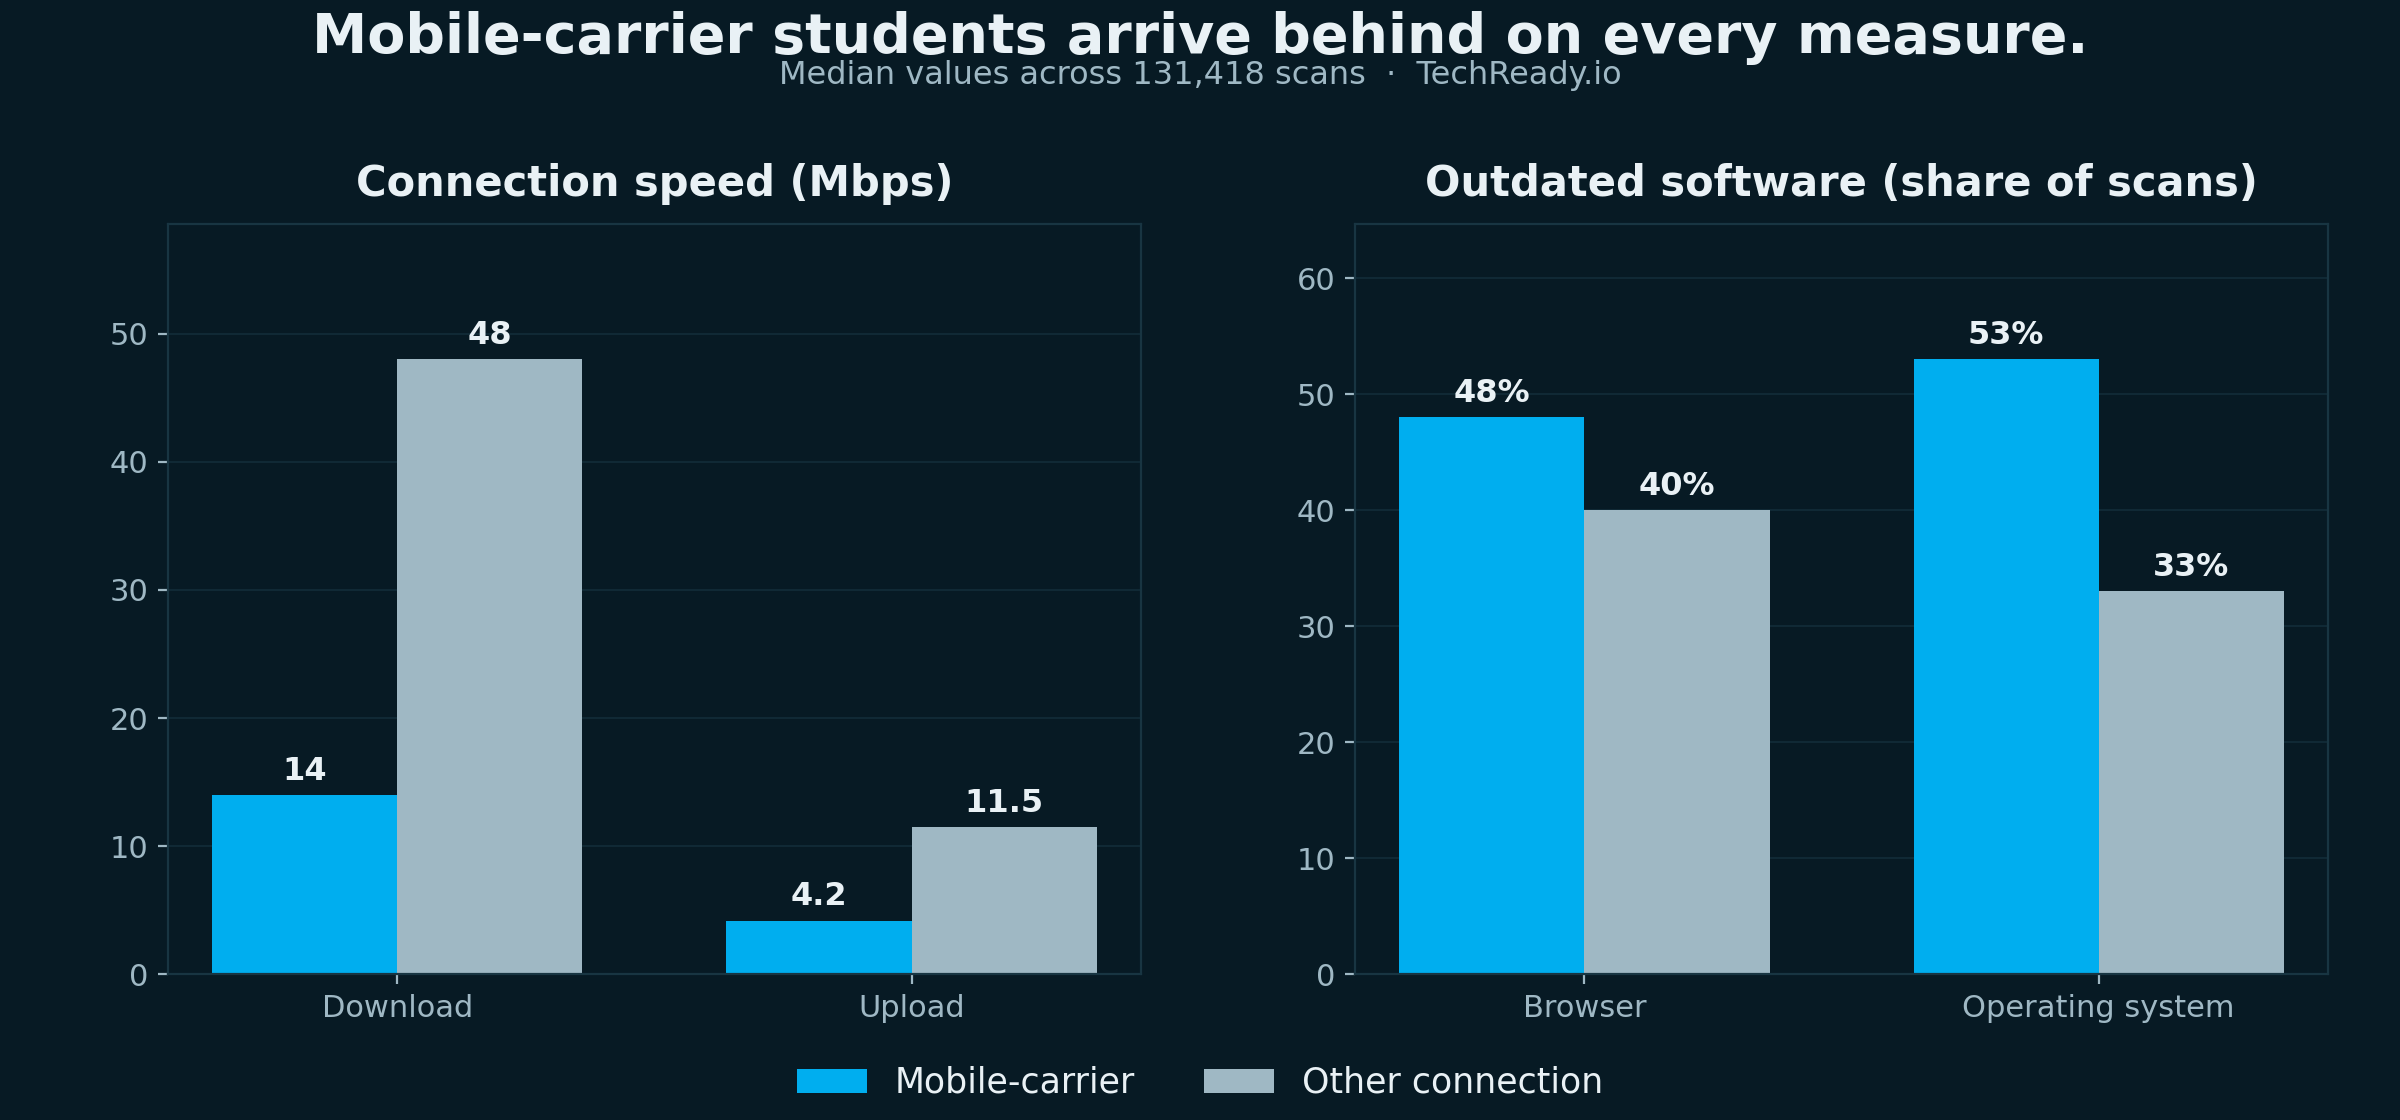
For online programs serving working adults, first-generation students, and rural or underserved regions, this is the clearest structural signal in the dataset, and it is measured directly: a third of the download bandwidth, less than half the upload, and markedly higher rates of outdated software.
- TLS version is a clean modernity proxy. TLS 1.3 now covers 84% of all scans, up from zero in 2017. Where older TLS persists, it concentrates in the same devices that are behind on browser and OS, making protocol version a reliable, objective read on how modern a population’s endpoints really are.
-
Why a longitudinal, objective view changes the conversation
Most readiness tools sell a point-in-time snapshot against a configurable bar. A nine-year record of directly-measured signals does something different: it separates the parts of the readiness problem that solve themselves (bandwidth, legacy plugins) from the parts that do not (device and browser currency, mobile-carrier access). That lets an institution stop spending effort where the trend is already favorable and concentrate it where the gap is stubborn and unevenly distributed.
For student success and retention leaders
Outdated browsers and operating systems are a persistent, measurable, unevenly distributed condition, one that a single pass/fail can smooth over. Treated as a persistence variable rather than a help-desk incident, it is exactly the kind of pre-behavioral signal most retention models omit.
“We have been treating device problems as help-desk incidents. This data says they are a persistence signal.”
For online program leadership
When a program launches, scales, or reaccredits, leaders are asked to defend decisions about platforms, proctoring, and synchronous sessions. Directly-measured, longitudinal, device-level evidence is more defensible than a composite score, because it does not depend on where any single institution sets its thresholds.
For equity and access work
The mobile-carrier gap is the closest thing in this dataset to a direct, device-level measure of digital-access inequality: bandwidth and software currency, not a proxy and not a score. It is measurable, and it is actionable.
“I assumed our students were a year or two behind the curve. I did not realize the gap was structural, and tied to how they access the internet.”
What this suggests for your institution
The trends in this report were produced by institutions measuring their own populations continuously and acting on what the measurement showed. A scan of your own students, run as a lightweight, voluntary check in an early course or onboarding step, produces the same directly-measured signals for your population, so you can see where you actually sit on these curves rather than assume.
Next step
If you would like to see what a baseline scan looks like for an online program of your size, and how to read the results against this longitudinal data, we would be glad to walk through it.
Email to book a 20-minute demo: info@techready.io